

Quick Answer
A February 2026 benchmark from SearchLight Digital puts the blended average Local Services Ads cost per lead at about $53 across home services trades, but that number alone will not tell you if the channel is profitable. What matters is your book rate and average ticket size. Start by setting a weekly budget, tracking how many leads actually book, and running a short test against Search Ads to see which one delivers a cheaper cost per paying customer.
“**TL;DR:** - Local Services Ads average about $53 per lead across trades, but actual costs vary from $39 for electrical work to $59 for drain or sewer services, depending on market and trade conditions. - The true cost per booked job can range from $87 to $182 depending on your book rate, making conversion rate more impactful than lead price alone. - Google bills only for valid leads, with charges adjustable through lead credits, and you can choose bidding modes like maximize leads or target cost per lead to control expenses. - Improving your profile quality and response speed can significantly lower your effective customer acquisition cost, especially when responding within five minutes to leads.”
Table of Contents
- What Do Local Services Ads Cost by Trade?
- How Does Google Bill for Local Services Ads?
- What Factors Push Local Services Ads Prices Up or Down?
- Are Local Services Ads Cheaper Than Google Search Ads?
- How Do You Turn CPL Into Cost Per Booked Job?
- How Can You Lower Your Real Cost Per Customer?
- When Should Local Services Ads Be Your Priority?
- Get More Booked Jobs From Every Local Services Ads Dollar
- Where to Verify These Numbers Yourself
- Sources
- FAQ
What Do Local Services Ads Cost by Trade?
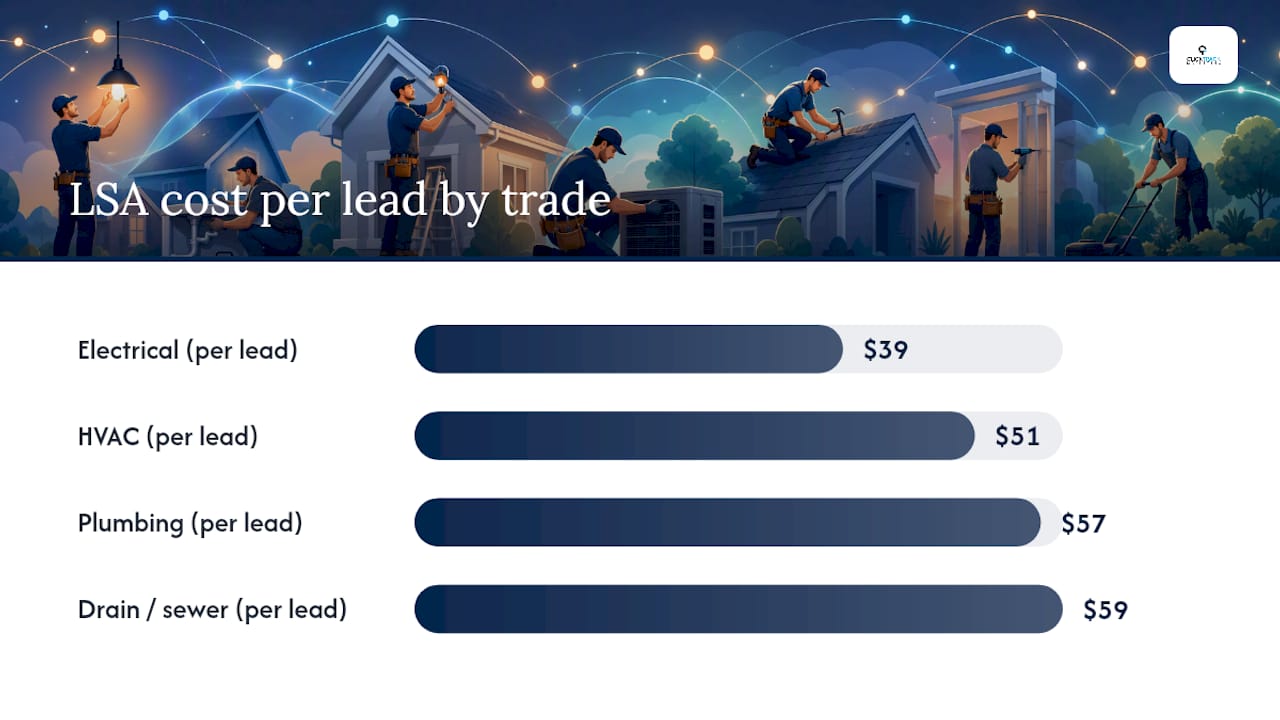
Home services businesses pay different rates depending on trade, and the spread is wider than most owners expect. SearchLight Digital's analysis of $6.72 million in LSA spend across 888 contractors and 126,650 leads found electrical work averaging around $39 per lead, HVAC near $51, plumbing closer to $57, and drain or sewer work landing around $59. Roofing tends to run higher and swing more, largely because job values vary so much from a minor repair to a full replacement.
That $53 blended figure is an average across trades and metros, not a number you should expect to see in your own dashboard. A contractor in a dense metro with heavy competition for the same service area will typically pay more per lead than one in a smaller market with fewer bidders. Winter storm season, for example, can spike HVAC and plumbing demand and prices in colder states, while roofing costs often climb after major weather events.
Pro Tip: Treat the $53 blended average as a starting reference point, not a target. Pull your own trade specific numbers from your Local Services dashboard after your first two or three weeks of spend.
How Does Google Bill for Local Services Ads?
Local Services Ads run on a pay per lead model, not pay per click. You set an average weekly budget, and Google calculates a monthly max using a simple formula: average weekly budget multiplied by 30.4, divided by 7. If you set a $350 weekly budget, your monthly max works out to roughly $1,520.
Google only charges you for what it considers a valid lead, meaning a phone call, message, or booking request from a real customer in your service area and category. According to Google's Local Services Help documentation, message leads are often priced lower than phone leads, and charges can be reversed through lead credits if a lead is later found invalid or low quality.
You also choose how bidding runs:
- Maximize Leads lets Google's system automatically bid within your budget to get you as many valid leads as possible.
- Max per lead lets you set a cap on what you will pay for any single lead.
- Target cost per lead aims for a specific average price across your leads over time.
Check your leads inbox and billing menu regularly. Credits happen, and they change your real net spend.
What Factors Push Local Services Ads Prices Up or Down?
Several variables move your price beyond the trade level averages. Urgency matters: emergency plumbing or HVAC repair calls tend to cost more than routine maintenance requests, since customers need someone now and Google prices that demand accordingly.
Metro competitiveness plays a major role too. A plumber in a major metro competing against dozens of other providers for the same zip codes will usually see higher CPLs than one in a smaller city with fewer competitors bidding for the same jobs.
- Lead type changes cost and quality. Message leads often run cheaper than phone leads, but phone leads sometimes convert at a higher rate.
- Profile quality affects both ranking and price. Reviews, license verification, and response speed all factor into how often Google shows your listing.
- Your budget and bid mode change volume. A low weekly budget limits how many leads you get and can prevent the algorithm from optimizing well.
Pro Tip: Respond to every lead within five minutes if you can. Speed to response is one of the few levers you fully control, and it often moves book rate more than any bid setting.
Are Local Services Ads Cheaper Than Google Search Ads?
On a pure cost per lead basis, yes, usually. SearchLight Digital's data shows LSA averaging around $53 per lead against a blended Google Ads cost per lead near $104, and non-branded search campaigns running closer to $149 per lead. That gap looks decisive until you factor in ticket size and book rate.
LSA leads often come in at a lower average ticket size than search leads, but they also tend to book at a higher rate, which is why Search Engine Land's analysis recommends running both channels rather than picking one. LSA provides predictable, pay per lead volume. Search Ads gives you keyword level control and room to scale once LSA capacity saturates.
- Judge channels by cost per booked job, not cost per lead alone.
- Test both for 30 to 60 days before cutting either one.
- Watch average ticket size by channel, since a cheaper lead that never books is worthless.
How Do You Turn CPL Into Cost Per Booked Job?
The math is straightforward once you have your numbers. Monthly leads equal your monthly budget divided by your average CPL. Booked jobs equal monthly leads multiplied by your book rate. Cost per booked job equals your monthly budget divided by booked jobs.
Here is how that plays out with a $2,000 monthly budget and a $53 average CPL, which generates roughly 38 leads:
- 1At a 30% book rate: about 11 booked jobs, putting cost per booked job near $182.
- 2At the 43.9% average book rate reported by SearchLight Digital: about 17 booked jobs, cost per booked job near $118.
- 3At a strong 60% book rate: about 23 booked jobs, cost per booked job near $87.
That range, from $182 down to $87 for the identical ad spend, shows why book rate matters more than CPL by itself. LeadTruffle's planning guidance recommends budgeting for roughly 10 leads per week early on, since Google's Maximize Leads algorithm needs enough volume to learn your account and optimize delivery.
How Can You Lower Your Real Cost Per Customer?
Reducing effective acquisition cost usually comes down to fixing what happens after the lead arrives, not just tweaking bids. Strengthen your Google Business Profile with verified licensing, recent reviews, and clear photos, since profile quality affects both ranking and lead price. A consistent local listings setup across directories reinforces that same trust signal.
- Build a booking flow that prequalifies callers fast, so your team spends time on jobs likely to close.
- Train scripts around common objections specific to your trade rather than generic sales language.
- Test a mix of message and phone leads, since one may convert better for your business than the other.
- Start in Maximize Leads mode for the first 30 days, then shift to a per lead cap once you understand your numbers.
Pro Tip: Connect every LSA lead to your CRM record for that job. Without that link, you cannot tell which leads actually turned into revenue.
Measurement is where most contractors leave money on the table. Tools like PeoplePixel identify who is engaging with your site beyond the leads Google reports, and pairing that with attribution reporting shows your true cost per paying customer rather than a rough guess based on CPL.

When Should Local Services Ads Be Your Priority?
Local Services Ads work best when you want predictable booked jobs in a trade that Google already trusts, and when your team can handle inbound call volume without dropping the ball. If your average ticket is high and your branded search converts well, running both channels and comparing cost per paying customer usually beats picking one. Marketing should function as infrastructure that proves revenue, not a scoreboard of leads and impressions.
Get More Booked Jobs From Every Local Services Ads Dollar
Click Track Marketing gives you something most agencies running Local Services Ads campaigns cannot: a clear line from ad spend to booked revenue, not just lead counts. Where typical LSA management stops at reporting leads and CPL, our approach layers in Answer Engine Optimization, Google Maps ranking work, and attribution reporting built to show exactly which leads turned into paying customers.

Our services include AEO strategy to help your business get cited in AI answers on ChatGPT and Google AI Overviews, PeoplePixel for identifying visitors who never fill out a form, PeopleLytics for weekly revenue attribution, and paid media management across Google Ads and Meta Ads. Onboarding is handled through OnboardIQ so setup does not stall your campaigns.
Expect measurable outcomes: a real cost per booked job instead of a guess, a clearer picture of which lead types convert, and budgeting decisions backed by revenue data instead of impressions. If you want a straightforward next step, see how our attribution system works and get a sense of what full visibility into your ad spend actually looks like.
Where to Verify These Numbers Yourself
Run your own budget math against a few primary sources before committing spend. Google's Local Services Help documents exactly how billing and lead credits work. SearchLight Digital's benchmark gives current trade level CPL data. LeadTruffle's cost and ROI calculator lets you model monthly leads and booked jobs with your own inputs, and a local listings setup guide helps you strengthen the profile signals that affect your price.
Sources
- Google Local Service Ads Cost Per Lead by Trade (2026)
- How leads work - Local Services Help
- Google Local Services Ads vs Search Ads leads
- Google Local Services Ads Cost | LeadTruffle
Want to know exactly which marketing is making you money?
Get a free attribution audit — we'll show you where your leads and revenue actually come from. Answer two quick questions to start.