

Quick Answer
A marketing agency with a reporting dashboard gives business owners a centralized, real-time view of every campaign's performance, tying spend directly to revenue. The industry term for this practice is performance reporting, and the dashboard is its delivery mechanism. Without one, you are paying for marketing you cannot measure. With one, you can see exactly which channels produce customers and which drain budget.
What does a marketing agency with reporting dashboard actually deliver?
The core promise is accountability. A performance reporting agency replaces monthly PDF summaries with a live view of the metrics that matter: revenue, return on ad spend (ROAS), customer acquisition cost (CAC), and conversion rates. These are outcome-based numbers, not activity counts.

The difference matters because most agencies default to reporting on effort. They show you impressions, clicks, and sessions. Those numbers feel like progress, but they do not tell you whether the marketing is making money. A proper analytics dashboard for marketing answers that question directly, every week.
Click Track Marketing's PeopleLytics platform is built on this principle. It delivers a weekly reporting dashboard that attributes revenue to specific campaigns, channels, and even individual visitors. That level of clarity is what separates infrastructure from aesthetics.
What features must a marketing agency's reporting dashboard include?
The best agency dashboards follow an inverted pyramid structure, placing primary KPIs at the top and granular channel data below. You should be able to read the dashboard's status in under five seconds. If you cannot, the layout is wrong.
The non-negotiable metrics at the top
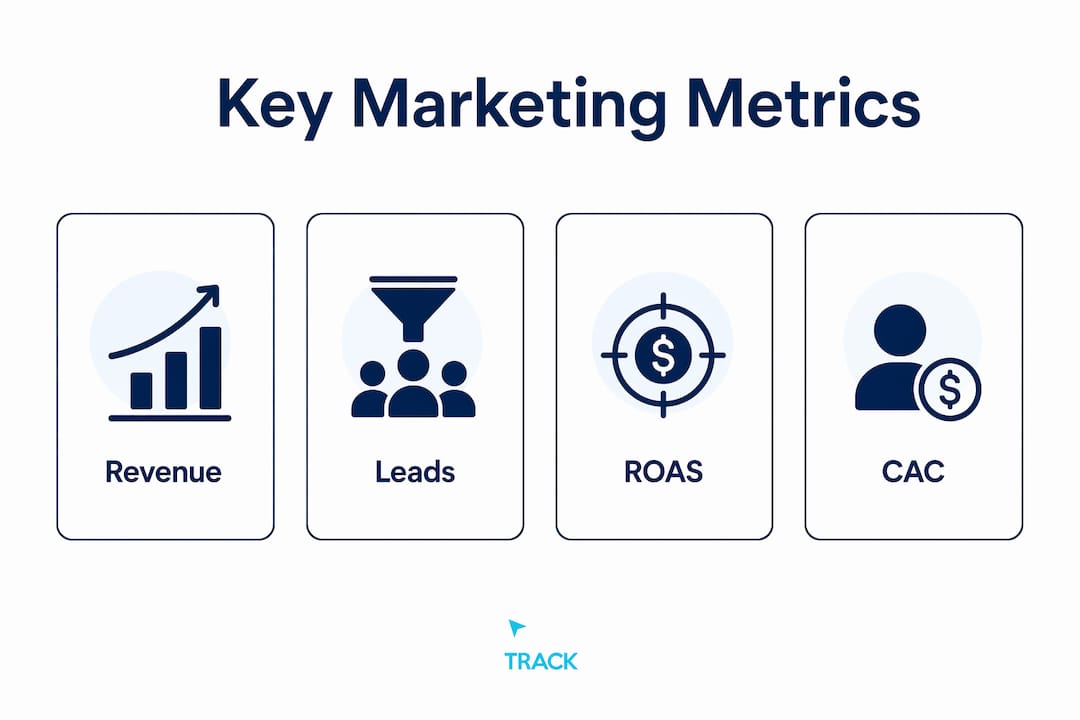
Every quality marketing metrics dashboard must display revenue, leads, ROAS, and CAC with period-over-period trend lines. Trend lines matter because a single number has no context. Knowing your CAC is $85 tells you little. Knowing it dropped from $120 over 90 days tells you the campaign is working.
Multi-channel data in one view
A full-funnel dashboard blends paid search, organic, email, and CRM data into a single client-facing view. Siloed reporting forces you to reconcile numbers across five tabs. A unified view shows shared outcomes: pipeline influence, cost per lead by channel group, and total revenue attributed across all touchpoints.
Automation and narrative layers
Agencies that implement AI-generated narrative summaries and automated report templates reduce reporting time by 60, 75%. That efficiency matters to you because it means your agency spends less time building slides and more time acting on the data. Color-coded alerts for metrics outside target ranges add another layer of clarity without requiring you to interpret raw numbers.
Pro Tip: Ask any agency you evaluate whether their dashboard sends automated alerts when a key metric drops below threshold. If the answer is no, you will only find out about problems at the monthly review.
The features below summarize what a quality dashboard must include:
- Revenue, ROAS, CAC, and leads with trend lines visible at a glance
- Multi-channel integration covering paid, organic, email, and CRM data
- Automated narrative summaries that explain what changed and why
- Color-coded alerts for metrics outside agreed targets
- White-label branding and a custom domain for a professional client experience
How does data reconciliation during onboarding protect your reporting accuracy?
Data reconciliation is the process of aligning how your agency and your business define the same terms. It sounds administrative. It is actually the most critical step in the entire reporting relationship.
The most common dispute in agency reporting comes from unreconciled source-of-truth metrics between the agency's platform and the client's CRM. Your agency might count a "lead" as any form submission. Your CRM might only count leads that pass a qualification filter. If those definitions never align, every report will show different numbers, and trust erodes fast.
What a data reconciliation audit covers
A proper audit, completed during onboarding, addresses four areas:
- Lead definitions: What counts as a lead in each system, and which definition governs the dashboard
- Revenue attribution: Which touchpoint gets credit when a customer converts through multiple channels
- Reporting sources: Whether Google Analytics, the CRM, or the ad platform is the agreed source of truth for each metric
- Attribution windows: How many days back the system looks when assigning credit to a campaign
Successful agency-client relationships complete this audit before campaigns launch. Doing it after the fact means reconciling months of misaligned data, which is expensive and damaging to the relationship.
Pro Tip: Before signing with any agency, ask for their onboarding checklist. If it does not include a data reconciliation step, build one into the contract yourself. Accurate lead tracking depends on it.
Click Track Marketing's OnboardIQ product handles this process systematically. It captures agreed definitions, attribution models, and reporting scope before a single campaign goes live. That upfront work is what makes the weekly PeopleLytics dashboard trustworthy from day one.
Which metrics should a marketing agency track in its reporting dashboard?
The right metrics depend on your funnel stage and campaign goal. The wrong metrics are the ones that look impressive but do not connect to revenue. Outcome-based KPIs support action, forecasting, and accountability. Vanity metrics support presentations.
The table below shows the metrics that belong in a performance-focused dashboard, organized by funnel stage.
| Metric | Funnel Stage | What It Tells You |
|---|---|---|
| Revenue attributed | Bottom of funnel | Which campaigns produced actual dollars |
| Customer acquisition cost (CAC) | Bottom of funnel | What you paid to acquire each new customer |
| Return on ad spend (ROAS) | Bottom of funnel | Revenue generated per dollar of ad spend |
| Conversion rate | Mid funnel | What percentage of visitors take a target action |
| Cost per lead (CPL) | Mid funnel | Efficiency of lead generation by channel |
| Qualified sessions | Top of funnel | Traffic that matches your buyer profile |
Dashboards that combine metrics across channels reduce reporting fatigue and simplify cross-channel decisions. The goal is shared outcomes, not isolated platform stats. Knowing your Facebook ROAS is 3.2x is useful. Knowing your blended ROAS across paid search, social, and email is 4.1x is more useful, because it informs budget allocation across the whole program.
Revenue-based marketing treats these metrics as the primary language between agency and client. Every metric on the dashboard should connect, directly or indirectly, to a revenue outcome. If it does not, it does not belong on the dashboard.
How can business owners use reporting dashboards to improve marketing ROI?
A dashboard is only valuable if you use it to make decisions. Most business owners look at reports after the fact. The owners who get the most from their marketing use dashboards to make adjustments in real time.
Pacing reviews and mid-cycle adjustments
Check your dashboard weekly, not monthly. Pacing reviews let you catch overspend or underperformance before the budget is gone. If your CPL is running 40% above target in week two of a four-week campaign, you have time to adjust the creative or the targeting. At a monthly review, that opportunity is gone.
Structured client review loops
Asking for feedback on missing or unclear metrics improves dashboards faster than any design change. After each reporting cycle, note which numbers prompted questions and which were ignored. That feedback loop tightens the dashboard over time, removing noise and surfacing the signals that actually drive decisions.
The following practices turn a passive dashboard into an active management tool:
- Schedule a 30-minute weekly pacing review with your agency contact
- Flag any metric that moves more than 20% week over week for immediate discussion
- Use quarterly business reviews to assess whether the KPI set still matches your business goals
- Require your agency to explain the "why" behind every significant change, not just the "what"
Dashboards as retention and strategy tools
Effective agency reporting is a retention instrument, not just a deliverable. The best dashboards create the conditions for strategic conversations. When you can see that paid search drove 60% of new customer revenue last quarter, you can have an informed conversation about whether to increase that budget or test a new channel. That conversation is only possible when the data is clear, attributed, and trusted.
Marketing attribution is the engine behind that clarity. Without it, you are guessing which channels to fund. With it, you are allocating budget based on evidence.
Key Takeaways
A marketing agency with a reporting dashboard is only as valuable as the accuracy of its data and the clarity of its metrics structure.
| Point | Details |
|---|---|
| Dashboard structure matters | Place revenue, ROAS, and CAC at the top so you can read performance in five seconds. |
| Data reconciliation is non-negotiable | Align lead definitions and attribution models during onboarding to prevent reporting disputes. |
| Outcome metrics beat vanity metrics | Track revenue, CAC, and conversion rates. Remove impressions and clicks from the primary view. |
| Weekly reviews outperform monthly ones | Pacing reviews catch problems while there is still budget left to act on them. |
| Dashboards should drive strategy | Use quarterly business reviews to reassess KPIs and reallocate budget based on attributed revenue. |
Why most agency dashboards fail before they start
I have reviewed a lot of agency reporting setups over the years, and the failure point is almost never the software. It is the conversation that did not happen before the software was configured.
Agencies rush to launch. Clients are eager to see results. So everyone skips the part where you agree on what "a lead" means, which system is the source of truth, and what the dashboard is actually supposed to answer. Three months later, the agency's dashboard shows 200 leads and the client's CRM shows 80. Both numbers are correct by their own definitions. Neither is useful.
The fix is governance, and it has to happen at the start. That means a written agreement on KPI definitions, attribution windows, and reporting cadence before a single campaign goes live. It also means building the dashboard around questions the business owner actually asks, not metrics the agency finds easy to report.
What I have seen work consistently is treating the dashboard as a product, not a report. A product has a user. It has a job to do. It gets improved based on feedback. When agencies build dashboards that way, the reporting relationship becomes a genuine asset. When they treat it as a monthly obligation, it becomes a source of friction.
Click Track Marketing builds dashboards as infrastructure. The marketing dashboard guide on our blog covers the structural principles in detail. The short version: if your dashboard does not answer "is the marketing making money," it is not doing its job.
How Click Track Marketing's reporting system works for you
Click Track Marketing's full-funnel AI marketing system is built around the principle that you should always know where your revenue is coming from. PeopleLytics delivers a weekly attribution dashboard that connects campaign spend to customer revenue, channel by channel. BuyerSignals surfaces intent data so you know who is in the market right now, not just who clicked an ad. PeoplePixel identifies anonymous site visitors your current setup never captures.
Every client relationship starts with OnboardIQ, which handles data reconciliation and KPI governance before campaigns launch. That upfront work is what makes the reporting trustworthy from week one. If you want a reporting setup that answers the question every owner actually cares about, a discovery call is the right next step.
Want to know exactly which marketing is making you money?
Get a free attribution audit — we'll show you where your leads and revenue actually come from. Answer two quick questions to start.